clustermon
UMAP of the Pokédex
Building a multi-lens UMAP projection of every base-form Pokémon, then clustering and visualizing the result. Notes from the workbench.
Try the Cross-Lens Explorer →UMAP
dimensionality reduction over the Pokédex feature matrixWe loaded the canonical PokéAPI tables into a single SQLite database, flattened every species into one wide feature vector (stats, types, abilities, move pool, egg groups, color, shape, habitat, growth rate, generation), z-scored the numeric block, then ran UMAP nine times (once per lens) at two output dimensionalities each. Four lenses come from the structured features above; two more (flavor, sprite) are dense embeddings of Pokédex text and official artwork; two are type-supervised fine-tunes of those encoders (flavor-ft, sprite-ft); and all is the L2-normalized concatenation of the four structured sub-blocks. The 2-D output is for the eye; the 10-D output is for HDBSCAN later.
| Lens | Input (rows × features) | Output (rows × 2) | Reduction ratio |
|---|---|---|---|
| all | 1,025 × 1,123 | →1,025 × 2 | 561.5× |
| stats | 1,025 × 6 | →1,025 × 2 | 3× |
| types | 1,025 × 36 | →1,025 × 2 | 18× |
| abilities | 1,025 × 284 | →1,025 × 2 | 142× |
| moves | 1,025 × 797 | →1,025 × 2 | 398.5× |
| flavor | 1,025 × 384 | →1,025 × 2 | 192× |
| flavor-ft | 1,025 × 384 | →1,025 × 2 | 192× |
| sprite | 1,025 × 512 | →1,025 × 2 | 256× |
| sprite-ft | 1,025 × 512 | →1,025 × 2 | 256× |

umap.UMAP(
  n_components=2,
  min_dist=0.1,
  n_neighbors=30,
  metric="cosine",
  random_state=42,
  n_jobs=1,
  transform_seed=42,
).fit(X) # X.shape = (1,025, up to 1,194)UMAP parameter sweep
140 fits across n_neighbors × min_dist, per lensUMAP has two knobs that dominate the look of the projection. n_neighbors sets how many nearest neighbors each point uses to build the local manifold; small values (5) preserve fine-grained local detail, large values (100) emphasize global structure. min_dist sets the floor on point separation in the embedding: 0.0 lets clusters pack tight (best for downstream HDBSCAN), 0.5 leaves breathing room (better for the eye). Each panel below is one full UMAP fit at those settings; points are colored by primary type so you can see when type structure resolves and when it dissolves.

n_neighbors=30, min_dist=0.1 (row 3, col 2); the 10-d input to HDBSCAN uses min_dist=0.0 to give the clusterer maximum density to work with.HDBSCAN
density-based clusters over the 10-d UMAP outputsHDBSCAN finds clusters of varying density without being told how many to look for. We feed it the 10-d UMAP output (the 2-d is for the eye; 10-d gives the clusterer room to find structure), run it across all nine lenses, and score each result against primary type as ground truth. Headline numbers at mcs=15: the all lens (L2-normalized concat of the four structured sub-blocks) and the types lens both clear ARI ≈ 0.93; the moves lens recovers type at ARI ≈ 0.54 without ever seeing a type label.
| Lens | Clusters | Noise | ARI vs type | ARI vs type-pair | NMI vs type |
|---|---|---|---|---|---|
| abilities | 22 | 131 (12.8%) | 0.127 | 0.087 | 0.340 |
| all | 18 | 35 (3.4%) | 0.933 | 0.486 | 0.952 |
| flavor | 11 | 495 (48.3%) | 0.072 | 0.044 | 0.204 |
| flavor-ft | 5 | 4 (0.4%) | 0.032 | 0.014 | 0.199 |
| moves | 14 | 143 (14.0%) | 0.536 | 0.284 | 0.616 |
| sprite | 2 | 111 (10.8%) | -0.002 | 0.004 | 0.031 |
| sprite-ft | 19 | 58 (5.7%) | 0.800 | 0.376 | 0.839 |
| stats | 2 | 0 (0.0%) | -0.002 | -0.001 | 0.007 |
| types | 18 | 0 (0.0%) | 0.958 | 0.463 | 0.985 |
| Lens | HDBSCAN | k-means best | DBSCAN | GMM best | Best baseline | Δ vs HDBSCAN | Supervised UMAP + HDBSCAN | Δ vs best unsup |
|---|---|---|---|---|---|---|---|---|
| all | 0.933 | 0.788k=18 | 0.878 | 0.892k=18 | 0.892gmm@18 | +0.041 | 0.958 | +0.026 |
| stats | -0.002 | 0.025k=18 | 0.000 | 0.025k=30 | 0.025kmeans@18 | -0.027 | 0.033 | +0.008 |
| types | 0.958 | 1.000k=18 | 0.964 | 1.000k=18 | 1.000kmeans@18 | -0.042 | 0.960 | -0.040 |
| abilities | 0.127 | 0.116k=50 | 0.104 | 0.108k=30 | 0.116kmeans@50 | +0.011 | 0.283 | +0.156 |
| moves | 0.536 | 0.426k=11 | 0.231 | 0.377k=18 | 0.426kmeans@11 | +0.110 | 0.899 | +0.363 |
| flavor | 0.072 | 0.045k=30 | 0.001 | 0.046k=18 | 0.046gmm@18 | +0.026 | 0.481 | +0.409 |
| flavor-ft | 0.032 | 0.185k=18 | 0.032 | 0.167k=11 | 0.185kmeans@18 | -0.153 | 0.608 | +0.423 |
| sprite | -0.002 | 0.094k=11 | -0.001 | 0.093k=18 | 0.094kmeans@11 | -0.096 | 0.537 | +0.443 |
| sprite-ft | 0.800 | 0.745k=18 | 0.522 | 0.740k=18 | 0.745kmeans@18 | +0.055 | 0.934 | +0.134 |
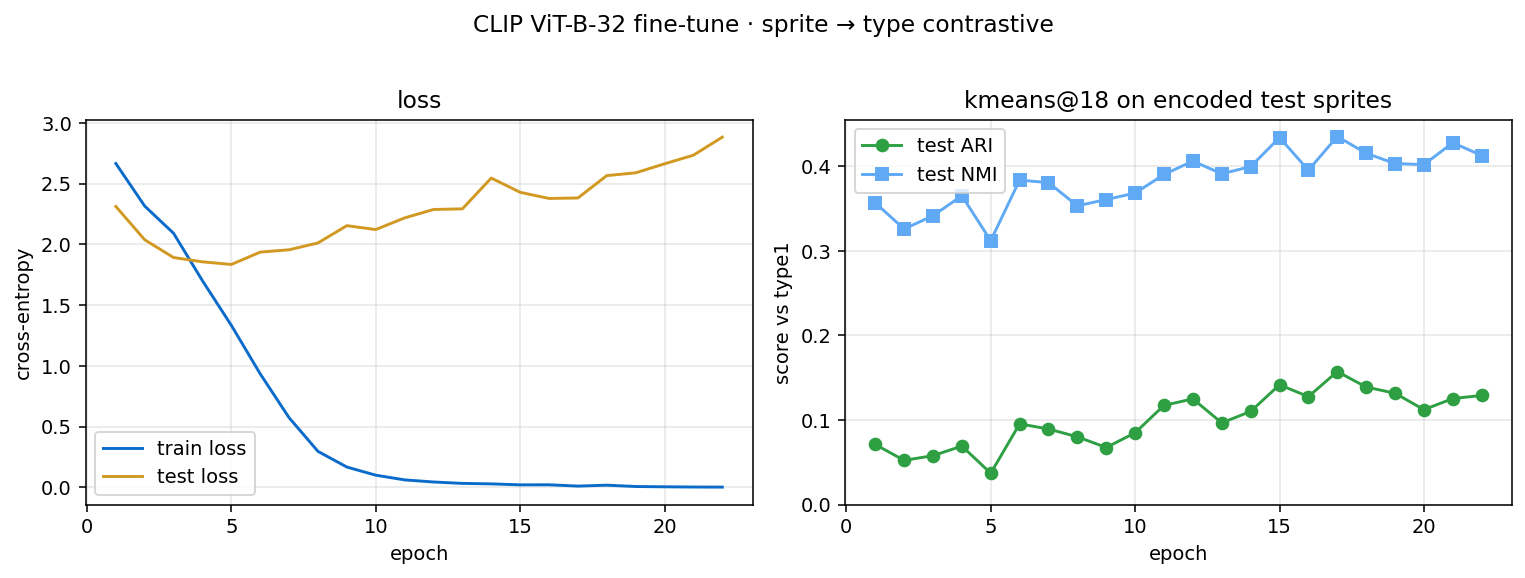
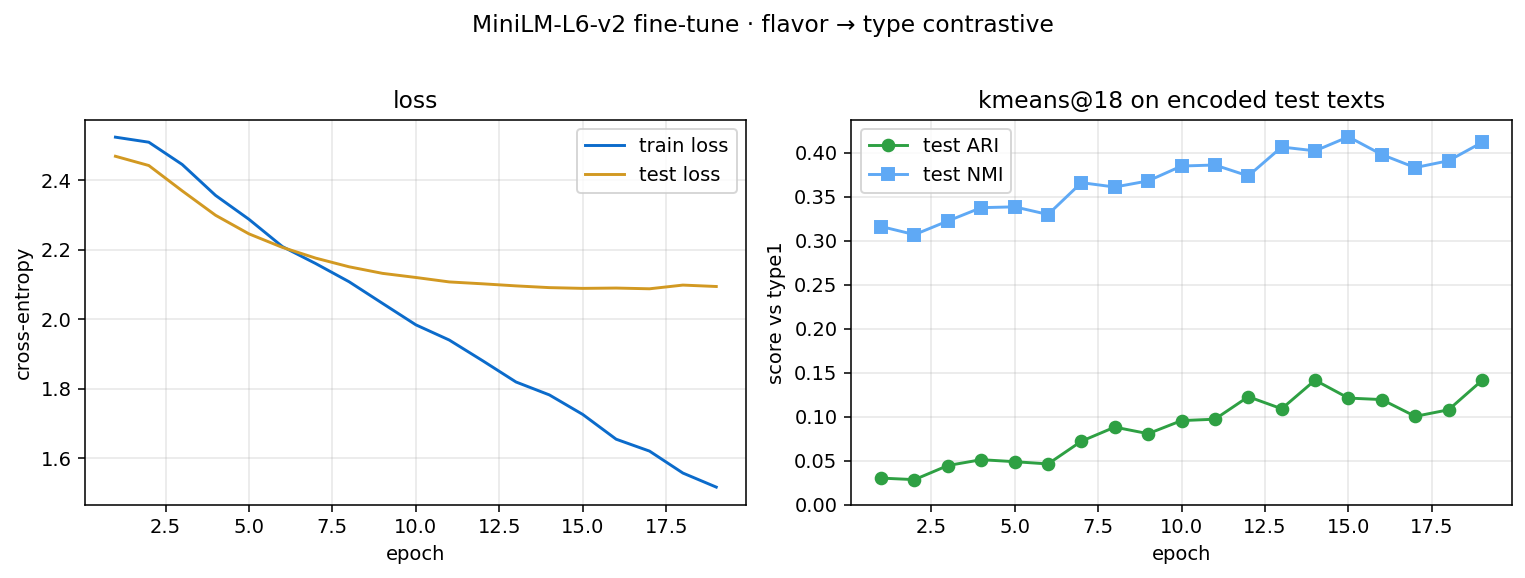
Two parallel fine-tunes ask the same question of two modalities: does in-domain type supervision unlock combat-type signal that the off-the-shelf encoder doesn't see? sprite-ft takes a ViT-B-32 vision tower and trains on 820 (sprite, type-prompt) contrastive pairs; flavor-ft takes MiniLM-L6-v2 and trains on the matching (Pokédex blurb, type-prompt) pairs. Both use 80/20 stratified splits, fp16 mixed precision, gradual unfreezing (last few blocks then full encoder), cosine LR with 100-step warmup, and early stopping on held-out test ARI. The prompt-encoder side stays frozen in both; the only thing changing is what the input encoder learns to look for.
| Lens | ARI off-the-shelf | ARI fine-tuned (test) | ARI fine-tuned (train) | Δ test |
|---|---|---|---|---|
| sprite → sprite-ft | -0.002 | 0.371 | 0.928 | +0.373 |
| flavor → flavor-ft | 0.072 | 0.025 | 0.033 | -0.047 |


Library-canonical evals
GLOSH outlier scores · cluster persistence · UMAP diagnosticsThree eval surfaces the libraries themselves treat as canonical but the page didn't show until now. GLOSH outlier scores rank every point by how far it sits from any cluster's dense core (∈ [0,1]; 1 = extreme outlier). Cluster persistence quantifies how robustly each cluster survives across the density hierarchy; the numeric companion to the dendrogram above. UMAP diagnostics show per-region embedding quality so you can spot where the projection had to lie.
cluster_persistence_. Color = relative persistence within this lens. Highest-persistence clusters tend to coincide with the highest LLM coherence scores (top-3 by persistence on the moves lens match clusters the judge rated 4 or 5), and noise-heavy lenses like flavor have lower median persistence. Numbers ground against domain truth, not just against each other.| cluster | size | persistence |
|---|---|---|
| #1 | 40 | 0.7865 |
| #2 | 27 | 0.6666 |
| #8 | 58 | 0.6177 |
| #9 | 58 | 0.6031 |
| #0 | 99 | 0.5423 |
| #13 | 33 | 0.5379 |
| #4 | 29 | 0.4703 |
| #6 | 79 | 0.4555 |
| #11 | 34 | 0.4492 |
| #7 | 63 | 0.4128 |
| #16 | 46 | 0.3867 |
| #3 | 131 | 0.3675 |
| #10 | 44 | 0.3600 |
| #12 | 40 | 0.3278 |
| #5 | 91 | 0.2973 |
| #14 | 30 | 0.2964 |
| #15 | 46 | 0.2365 |
| #17 | 42 | 0.2125 |


Each lens has its own self-contained datamapplot HTML: zoom, pan, search by Pokémon name, hover any point for its type and cluster id, cluster centroids labeled with the dominant type.
Pick any Pokémon and see how each of the nine lenses describes its neighborhood. Same creature, nine different recommendation engines, watch them disagree. Click any neighbor sprite to navigate. This is the project's deliverable demo.
Three things the machinery told us
Findings that weren't visible until the pipeline produced numbers- Move pools alone encode most of type identity. The
moveslens recovers primary type at ARI 0.54 unsupervised and 0.90 with supervised UMAP, without ever seeing a type label. After the L2-balanced rebuild, the combinedalllens reaches 0.93 — close to the supervised ceiling — meaning the structured features taken together carry the type signal almost completely, with moves doing most of the heavy lifting. The dual-type (type1, type2) ARI is a stricter measure and lands around 0.49 for both, suggesting secondary type is genuinely harder to recover from any single feature surface. - Fine-tuning works for vision, but text remains harder — the modality matters. The pretrained sprite lens scored ARI -0.002 vs primary type; fine-tuning the ViT-B-32 vision tower on 820 (sprite, type-prompt) pairs lifted held-out test ARI to 0.371. Running the same recipe on the text side — fine-tuning MiniLM on (Pokédex blurb, type-prompt) pairs — only moves test ARI from 0.072 to 0.025. Pokédex blurbs are written without combat type in mind; even with supervision the encoder can only find what's in the input.
- GLOSH outliers on the flavor lens cleanly surface Ultra Beasts. Top-5 by outlier score: Kartana (0.839), Celesteela (0.838), Pheromosa (0.837), Nihilego (0.837). Four-of-five are the canonical "weird" Pokémon subgroup, with no supervision and no mention of "Ultra Beast" anywhere in the feature matrix. The eval surface independently validated against domain truth.